|
In Iowa City, second shift workers play a vital role in the community's prosperity and productivity. However, they face unique challenges when it comes to transportation, as public transit often falls short during late hours. It is time we address this disparity and advocate for the implementation of late-night bus service to support these hardworking individuals, ensuring a more inclusive and supportive environment for all residents.
Ensuring Equitable Access to Employment: Approximately 15-20% of the U.S. workforce is classified as second shift workers. These individuals typically work during the afternoon and evening hours, usually starting late afternoon and ending around midnight. Second shift workers, including those in healthcare, hospitality, and manufacturing, contribute significantly to Iowa City's economy. By providing late night bus service, we can ensure that these essential workers have reliable and convenient transportation options, enabling them to reach their workplaces and contribute to the city's growth. Enhancing Safety and Security: Late-night commutes can be challenging, especially for those who work in less well-lit areas or have limited access to transportation options. With late night bus service, we can provide a safer and more secure commute for second shift workers, reducing the risks associated with walking long distances or relying on private vehicles during late hours. Fostering Work-Life Balance: The availability of late-night bus service can significantly improve the work-life balance of second shift workers. A reliable and accessible transportation option empowers them to spend more time with their families, engage in community activities, and participate in local events, contributing to a stronger sense of belonging and well-being. Easing Financial Burdens: For second shift workers who face limited transportation options, private vehicle usage or ride-sharing services may become costly, impacting their overall financial well-being. Late night bus service offers a more affordable alternative, alleviating financial burdens and enhancing economic stability for these individuals. Reducing Traffic Congestion and Environmental Impact: By encouraging second shift workers to use public transportation, late night bus service can reduce the number of private vehicles on the road during late hours. This reduction in traffic congestion not only leads to smoother commutes for all but also contributes to a greener and more sustainable environment, aligning with Iowa City's commitment to environmental conservation. Promoting Social Inclusion: Second shift workers, like any other group, deserve to be included in the city's transportation planning and decision-making. By providing late night bus service, we demonstrate our commitment to social inclusion and affirm that Iowa City is a place where every resident's needs are valued and catered to. As a vibrant and progressive city, Iowa City has a responsibility to ensure that all residents have equal access to opportunities and services, including reliable transportation options for second shift workers. Implementing late night bus service is not just a matter of convenience; it is an essential step towards building a more inclusive, sustainable, and thriving community. Let us advocate for this much-needed change, supporting those who work tirelessly during non-traditional hours. By providing late night bus service, we demonstrate our commitment to equity, safety, and environmental consciousness, making Iowa City a city that truly cares for all its residents. Together, we can create future where every member of the community thrives, regardless of the hours they work.
0 Comments
On April 21st, CTC held the Employee Access to Transportation Seminar where we presented recent transit developments to employers in the Johnson County area. We discussed how employers can help ensure their employees have adequate and reliable transportation by advocating for late-night and Sunday transportation. Check out the presentation here. This week, the Community Transportation Committee wants to inform you on a program with the same notion we have - transportation should never be a barrier to employment. Some communities simply do not have the density to support circuitous or traditional bus service and need scheduling flexibility. Cedar Rapids is one of those communities. As a result, in 1995, the Neighborhood Transportation Service (NTS) was created to provide better transportation options in the Wellington Heights neighborhood. NTS provider Kelzye Bedwell says, “As many jobs in Cedar Rapids moved further from the town center, individuals faced huge barriers in getting to and from work during second and third shift. Oftentimes cabs wouldn’t take riders in the neighborhood, so many individuals were left without options. A televised town hall brought to light the issues and sparked a collaboration between the Harambe House and United Way of East Central Iowa. Twenty-five years later NTS has expanded to serve all of Cedar Rapids, Marion, and Hiawatha.” Last year, the program provided over 30,000 rides - something we know deserves to be celebrated! For $6 a ride, community members can book their ride in advance by using the NTS app, available on both the App Store and Google Play, or by calling the main office. Eventually, they hope to expand this service to all of Linn County, Iowa. The biggest benefit of this program is that it allows citizens to work second and third shift jobs and access necessary transportation. Bedwell says, “Many places in the nation, especially cities of our size, do not have evening transit available. I am so incredibly proud to be part of continuing to provide the option of night-time transportation and doing everything in my power to improve it.” She says one of the challenges they are often facing is tight funding because it limits their ability to expand service to new populations, but that they are actively seeking new partnerships to alleviate costs. As a nonprofit, working to expand affordable and accessible transportation in Johnson County, we are impressed with what Horizons has accomplished and would like to help work to make more programs like this available in Johnson County. Visit here for more information about the program: https://horizonsfamily.org/nts/ 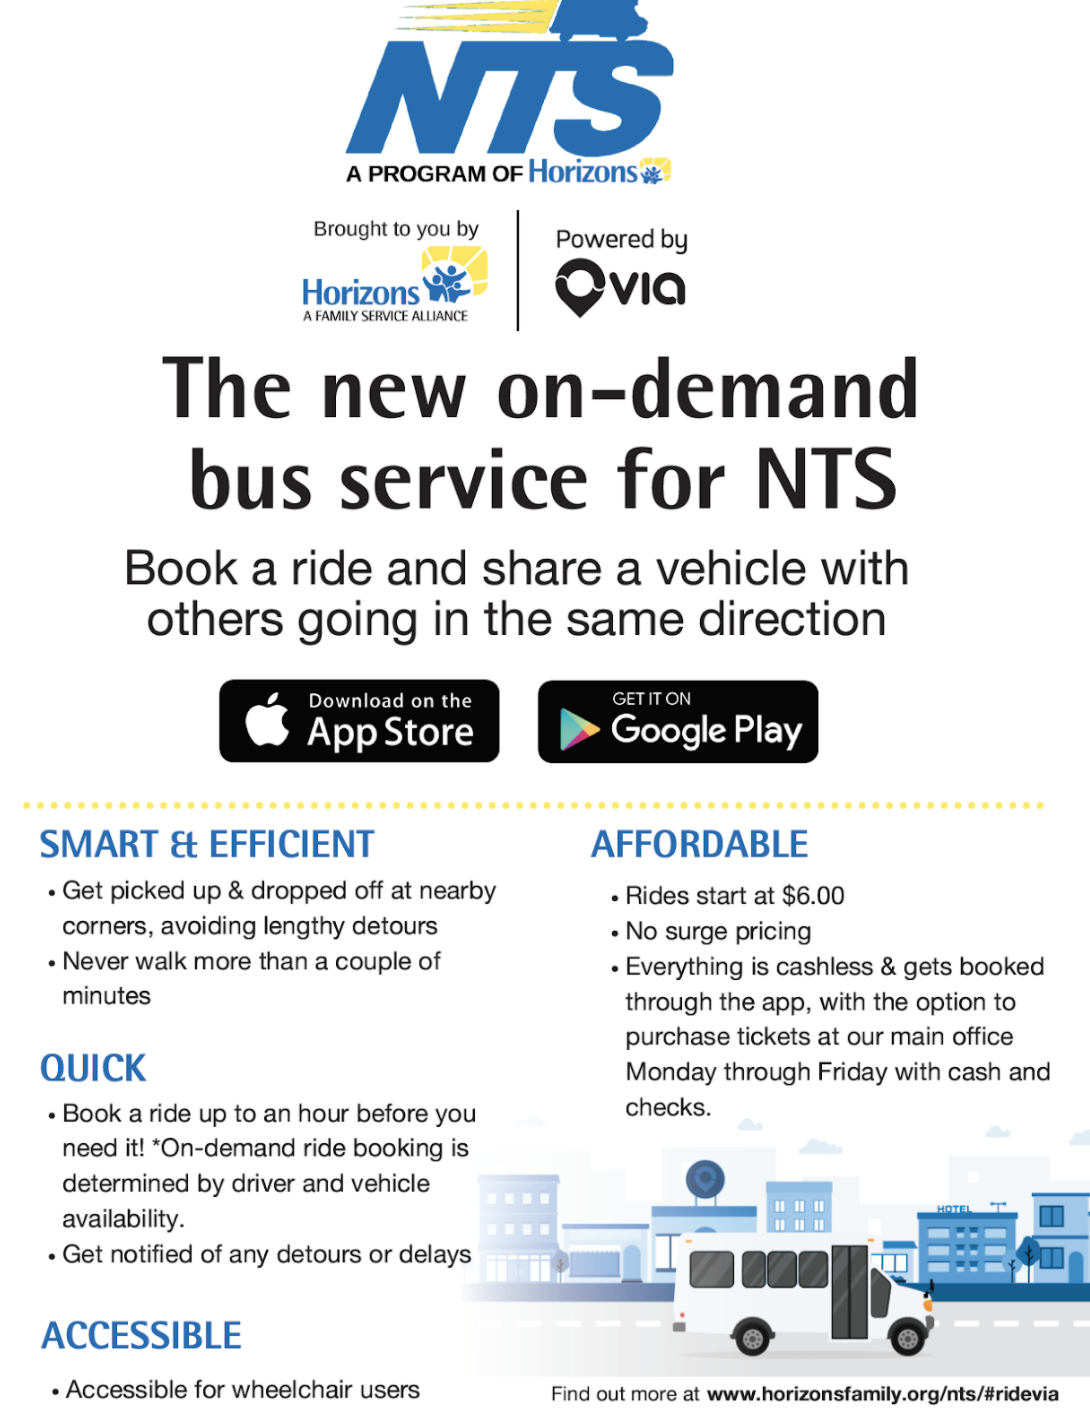 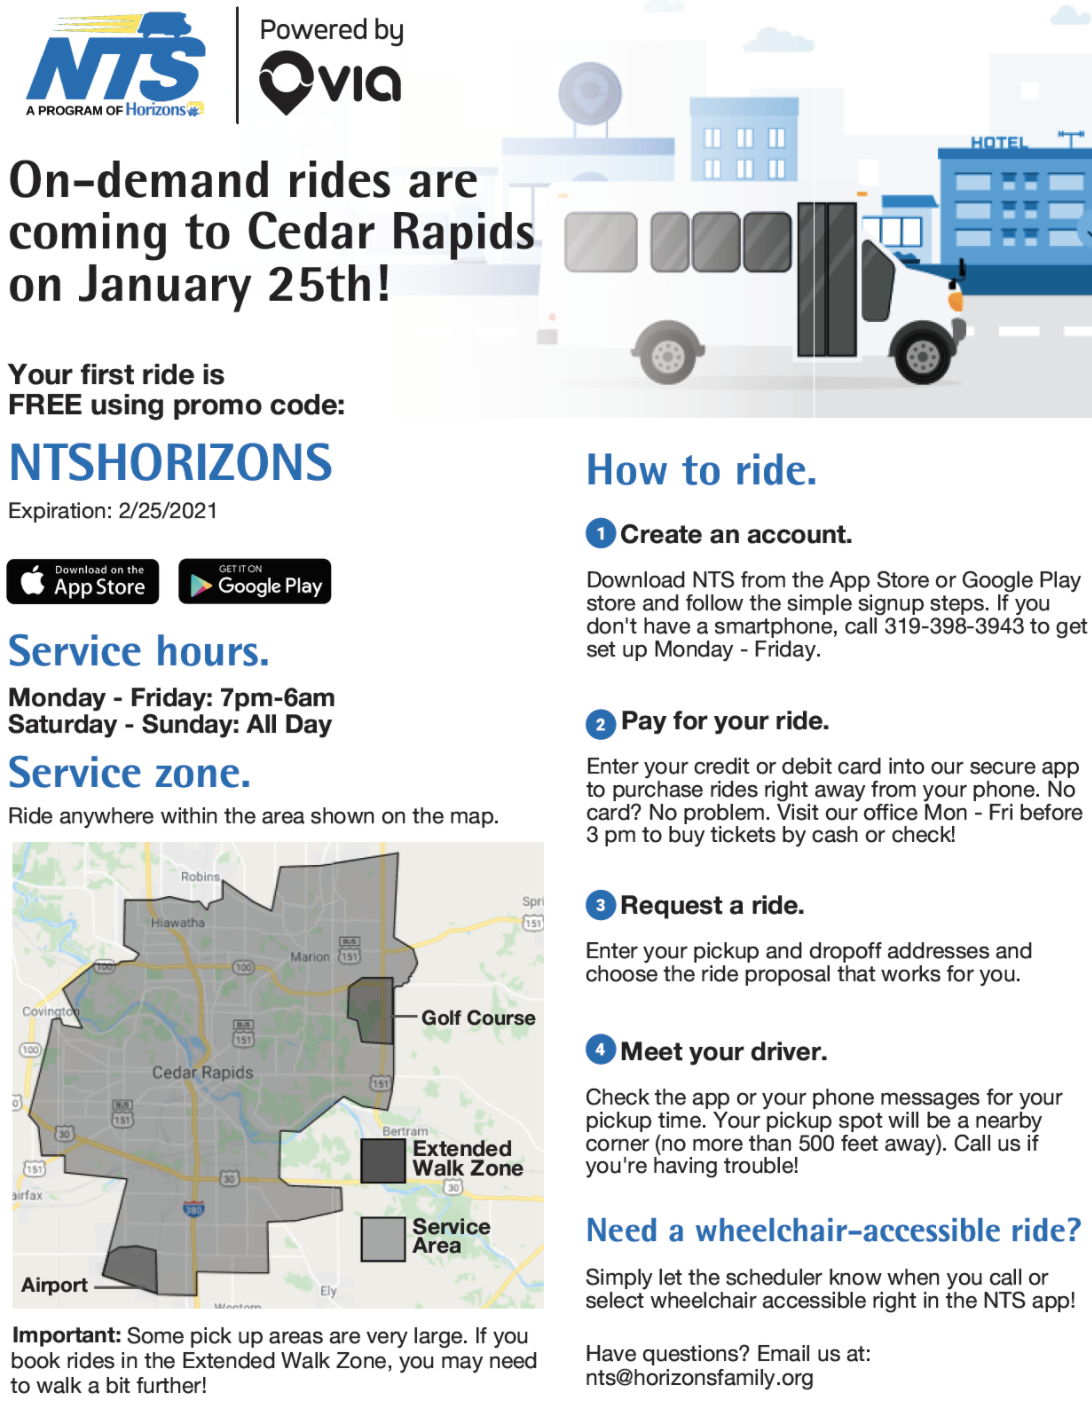 On Tuesday, December 22nd, CTC sat down (virtually, of course) with North Liberty’s Special Projects Coordinator, Angela McConville. Just like CTC, she is working to make transportation more accessible and affordable for North Liberty residents. After other efforts to provide traditional public transportation in North Liberty were pared down to just two trips per weekday, the Transit Advisory Committee – chaired by Mayor Donahue – created the North Liberty Transportation Assistance Program (NLTAP) because a gap exists between those with vehicles and those without. The main goal of this program is to provide residents with transportation to their most basic needs such as doctor appointments and grocery stores. The program partners with Yellow Cab to provide rides to and from a cardholder’s address. There are four ways in which North Liberty residents can qualify for a NLTAP card: they do not own a car in their name, they meet minimum financial requirements, they are living with a disability and are unable to drive, or they are experiencing a temporary disability. A person must meet only one requirement to qualify for the program. There are currently around 135 cardholders who call a special Yellow Cab phone number to schedule a $1 ride Monday through Friday, 7am to 10pm and Saturday from 7am to 7pm. The budget for the program is currently $50,000 a year and comes from North Liberty taxpayers. Angela told us that since this program is limited in scope and scale (without much room for leniency or expansion), she is exploring ways to enhance the transportation options in North Liberty with new, creative demand-response programs, so North Liberty can provide user-fee-supported transportation without limitations. To find out if you qualify for the program or to read more, check out their website here: https://northlibertyiowa.org/NLTAP. The Community Transportation Committee would love to see other cities in Johnson County get creative like North Liberty in terms of providing transportation when traditional service isn’t an option. 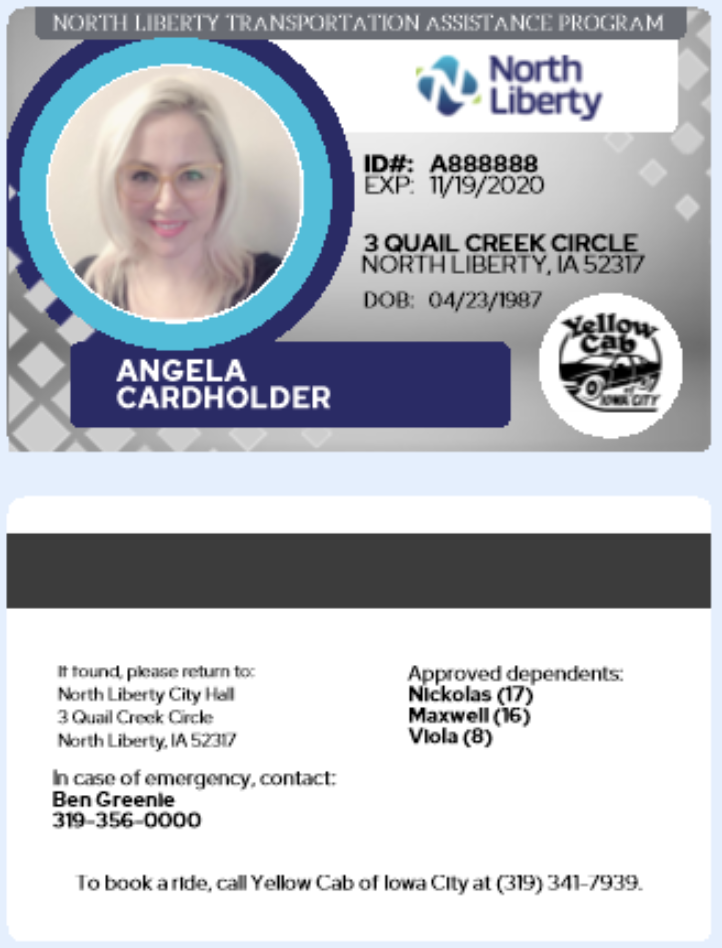 A sample of what the NLTAP member cards look like. 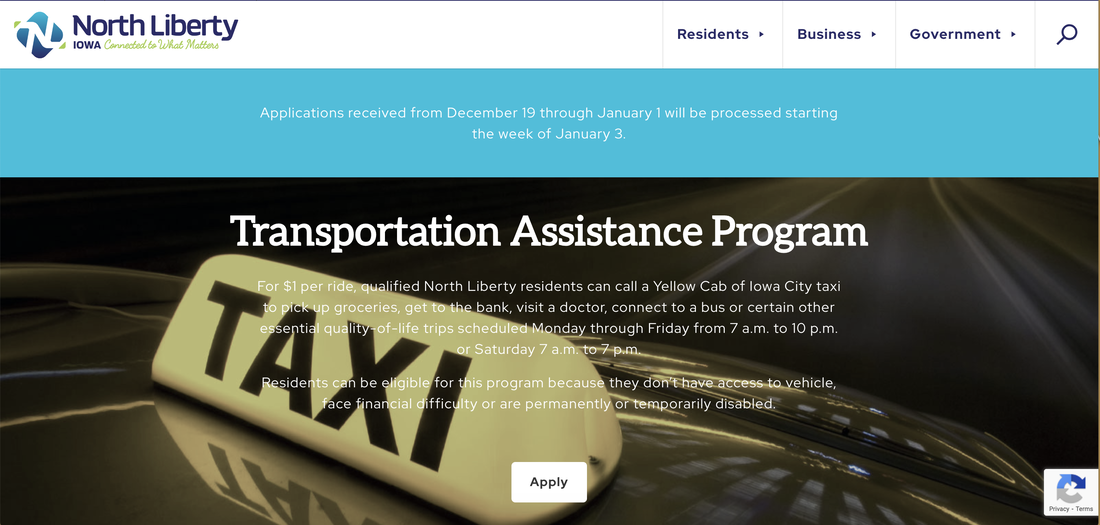 The NLTAP website. The Impact of the CTC Covid-19 Relief Bus Pass Program at the Coralville Community Food Pantry12/18/2020 In November, the Community Transportation Committee received a grant from Iowa Workforce Development that allowed us to create the CTC COVID-19 Relief Bus Pass Program. This program was designed to assist job seekers affected by COVID-19 with transportation to job interviews or training at their new job. We have distributed bus passes to the following Johnson County organizations: Shelter House, Coralville Community Food Pantry, Inside Out Re-entry, and Domestic Violence Intervention Program. With this program, CTC hopes to help increase the chance of financial security for our community members. Accessible and affordable transportation is essential for anyone to maintain employment. Until the fares are free, CTC will continue to do our part in making transportation more affordable for Johnson County. John Boller, the Executive Director of the Coralville Community Food Pantry, provided CTC with insight into the intersection of food insecurity and lack of adequate transportation. To get involved with this organization, visit their website here: https://www.coralvillefoodpantry.org/ I want to give you space to tell us about the pantry, your mission, and anything you’d like about what you do day to day. At the Coralville Community Food Pantry, we consider ourselves the primary food safety net for Coralville and Tiffin residents experiencing food insecurity. Our programming is aimed at ensuring that all of our neighbors get the food they need and deserve. Our primary work is our food assistance program, which provides a variety of groceries and nonfood personal care items, which people select themselves, each time they visit. For community members who lack the ability to get to our physical facility, we offer free weekly deliveries of groceries and nonfood personal care items. What current transit issues affect the clients you serve? A recent survey of our clients showed that nearly 50% of folks don't have a car. Of that group, most carpool, many walk, and some take the bus. Complaints we've heard about the transit system is that it's unreliable, takes too long to get places, and it's obviously difficult to haul 50-60 pounds of food with you. How do you see food insecurity and transportation barriers intersect? They are deeply interconnected! People who are struggling to afford food are also struggling with mobility issues. And oftentimes, lack of or limited transportation can keep many people from accessing vital community resources like food pantries. What impacts do you foresee the CTC Covid 19 Bus Pass Relief Program having at the pantry? It's amazing! We are grateful for the opportunity to distribute bus passes to our clients who rely on public transportation, or perhaps those who typically walk but would prefer to take the bus. For many, having access to public transit will allow folks to seek out and hopefully retain critical employment during these challenging times. What is the most important thing to know about food insecurity? It is a symptom of deeper inequalities and poverty. Until we have stronger anti-poverty policies in place such higher wages, affordable living options, and universal healthcare & childcare, food insecurity will always persist. How can someone in the community get involved to help combat food insecurity? We're always in need of volunteers to help on the frontlines at the pantry or to make home deliveries (another effective way to combat the transportation issue). Dear State of Iowa COVID19 Task Force, Kim Reynolds Administration:
You purposely made it so the only way asymptomatic people in Johnson County could get tested is by risking exposure that renders the test moot. TestIowa is only for the privileged who have cars. Any individual lucky enough to be able to get a ride with a friend willing to risk their own life driving someone in the enclosed space of a vehicle for half an hour or longer to Cedar Rapids puts themselves and their friend at risk. Or, you have to take the 380Express bus (a bus service FINALLY made after 40 years- but only temporary, during the construction on the Interstate highway), again for drivers only and those who don't or can't drive. Anyway, you actively exclude, clearly don't count--putting yourself at distinct risk on public transit for an hour or an hour and a half in an enclosed space with a number of other people. Then, when you get to Cedar Rapids, you have to take another bus and walk, if you're able to, to get to the TestIowa site... where they discriminate against people who don't have cars. On top of that--depending on when your appointment is, but for most appointments, you can't get home [on the bus]. The 380Express bus runs at such limited time, and again, requires taking another CR City bus to get to it that for a late afternoon or evening test you'd have to stay in Cedar Rapids overnight, spending money on a hotel (a huge cost and a huge Corona exposure risk) or find a friend to stay with. What is the point of getting a test if then you're going to be exposed indoors while sleeping for 6-12 hours in a new house that you don't live in, with a person you're not intending to have serious contact and exposure with? What happens if I go up to get a test and don't have a person to stay with? Will C.R. police harass & arrest me for trying to sleep on the street? Will I get sick from walking to a shelter & staying with 50 other people who don't wear masks some sleeping? Or walking there only to get turned away? Will I get mugged or raped trying to sleep in a park? Or, do I spend $50 staying in a hotel, another $20 on a cab ride there--plus a long cold walk, or hot humid walk this summer, & more exposure in a vehicle with a new person, then on the City bus or 2 City buses in the morning before the 380Express bus back. That's $77 minimum. Then, when I get back to Iowa City, I have to walk and wait up to an hour to get on another bus to get home or to work. A vehicle is a huge expense that not everyone has. Where and what is the testing set up for people who are on foot, bicycle, or wheelchair? You do not care about people who aren't the middle-class; you do not care about poor people. You do not care about actually stopping corona spread, clearly. People who don't drive are an afterthought in your testing planning. You do not consider us people. We are not in your usual planning, even in the case of a life-threatening, global pandemic. All of the messaging is "drive-thru testing"; get a test "from your car." (My car?) I guess you're going to give me a car when I get a test? For poor people or "those dang socialists in Johnson County/Iowa City." Isn't it funny how the self-ambulating or non-ambulating &/or poor in the "liberal" area who are asymptomatic, but likely asymptomatic carriers, in this top densely populated spot have had zero way to get a test until just a few weeks ago? - Anonymous Dear Council,
On October 6th, the Iowa City Area Transit Study team presented the Preferred Alternative Scenario to the Iowa City City Council for consideration. The presentation included changes to bus routes expected in the short term as well as long term goals and their associated benefits and costs. Two of the lowest cost improvements were Universal Passes, which would unify and simplify Iowa City and Coralville’s disjointed ticketing systems, and the on-demand Night Owl service, which would provide rides for workers getting off late at night. Currently, the Preferred Alternative Scenario does not include Sunday service, one of the top improvements workers in Johnson County have asked for. The presentation did not address concerns about current service gaps experienced by disabled bus pass holders. The introduction of universal bus passes would allow for the ease of traveling between Iowa City and Coralville without leaving anyone behind. The current fare system is inadequate for serving our community; only the most expensive pass (the 31-day pass) allows passengers to travel between the Iowa City and Coralville transit systems. If riders have purchased a 24-hour or 10-ride pass, they can only use it on either Iowa City or Coralville buses. To add to the problem, riders with discounted fares are not permitted to ride before 9 am and between 3:30 pm and 6:30 pm on Monday through Friday. We are requesting that you reevaluate the purpose of this policy that prevents people with these fares from using the bus at their discretion, this policy wildly limits the independence of those with such passes. We request that you immediately look into how to provide the Night Owl Service. This service could be provided in a variety of ways, including by partnering with local transportation providers. The need for this service is becoming more urgent as the weather gets colder. Johnson County workers should not have to walk on the highway (often in the dark) in order to commute to work simply because their ticket does not allow them to take the bus when their shift starts/ends, or there are no buses available. In order to provide these services and continuously improve the transit systems, the council should invest in Universal Passes and Night Owl services, and work to build partnerships with employers to fund transportation both late at night and on Sunday. We have the opportunity to get this right and the changes that our community have asked for are clear; transportation is a public service that should be accessible to all. Thank you, Community Transportation Committee On Tuesday, October 6th at the Iowa City City Council Work Session, the Iowa City Area Transit Study will be presenting possible changes to our community's transportation. We have been educating city council members on the issues experienced by those who use the bus and hope that they use this opportunity to do things right and improve transit for underserved communities. Read the letter we sent to council expressing our concerns: Dear Iowa City Council, As you listen to the recommendations presented by the transit study and prepare to finalize transit system changes, we again encourage you to improve the system for those currently in need of the service. This is a service that should be accessible to all, and yet second-shift, low-income, and disabled community members are being left behind. On October 1st, CTC held a Community Meeting on Improving Transit in which several community members voiced their concerns. One commuter anecdote detailed the 45-minute bus commute that necessitates them arriving over 30 minutes early to work versus a 10-minute car commute. Another bus rider explained how she couldn't afford the fare when she had to switch between Iowa City and Coralville buses, which requires some commuters to buy at least two passes. Every day, workers are forced to walk home in the middle of the night because there's no service available when they get off work. Our community needs Sunday service and night service. We are asking for you to get creative: can we provide a taxi voucher for service until midnight? What routes would make the most sense to run on Sundays? What funding can the city apply for to provide these basic services? Are there public-private partnership opportunities with employers in our community? If the funding does not currently exist, we need to find it. We also request that you eliminate the current policy that prevents those with disabled passes from riding during peak times; this policy is extremely discriminatory as it limits the independence of those with such passes. Thank you, Community Transportation Committee We will be having a watch party to listen to the recommendations made by the Transit Study and discuss the impact they may have on the community. This meeting is at 5:00pm. Please join at the following link: https://uiowa.zoom.us/j/91662829268
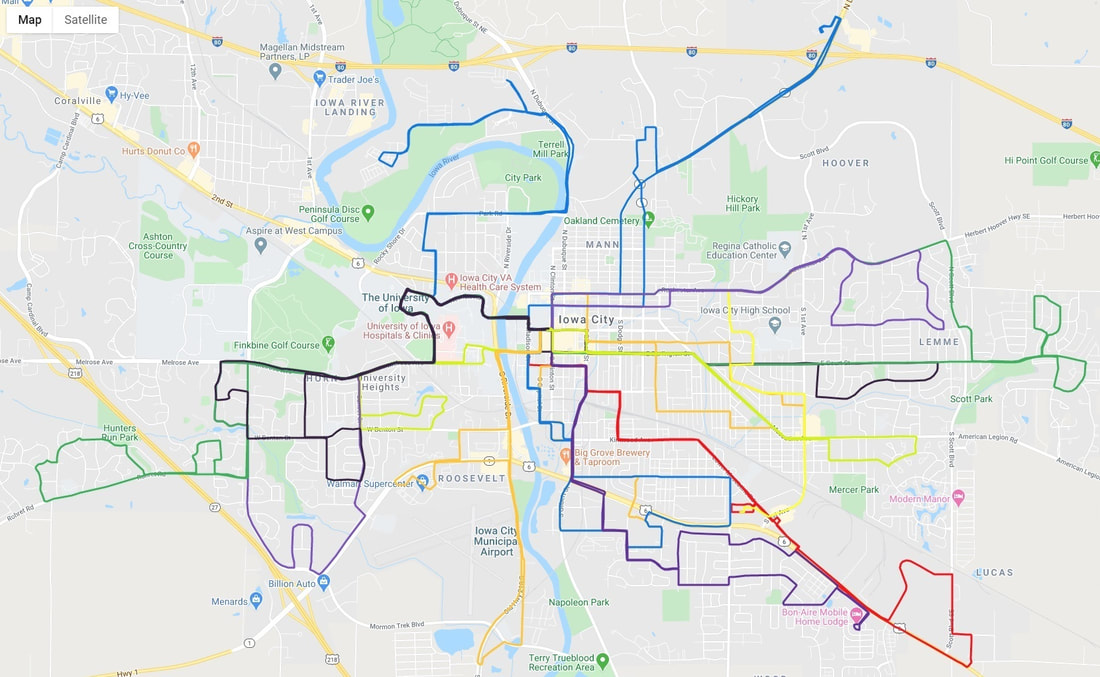 Current Iowa City Transit System Map The Iowa City Area Transit Study Survey offers the opportunity for residents to give their opinion on preferred aspects of three scenarios for Iowa City area bus routes. These changes aim to improve the speed, reliability, and frequency of the buses. The Transit Study scope is limited by the constraint that it must improve the bus system without any change in the allocated budget for the buses. Because of this, none of the scenarios expand the bus system without consolidating routes to make up the difference in the budget. Depicted below are the current routes which the Transit Study aims to improve. View a Side-by Side Comparison of the Transit Scenarios. 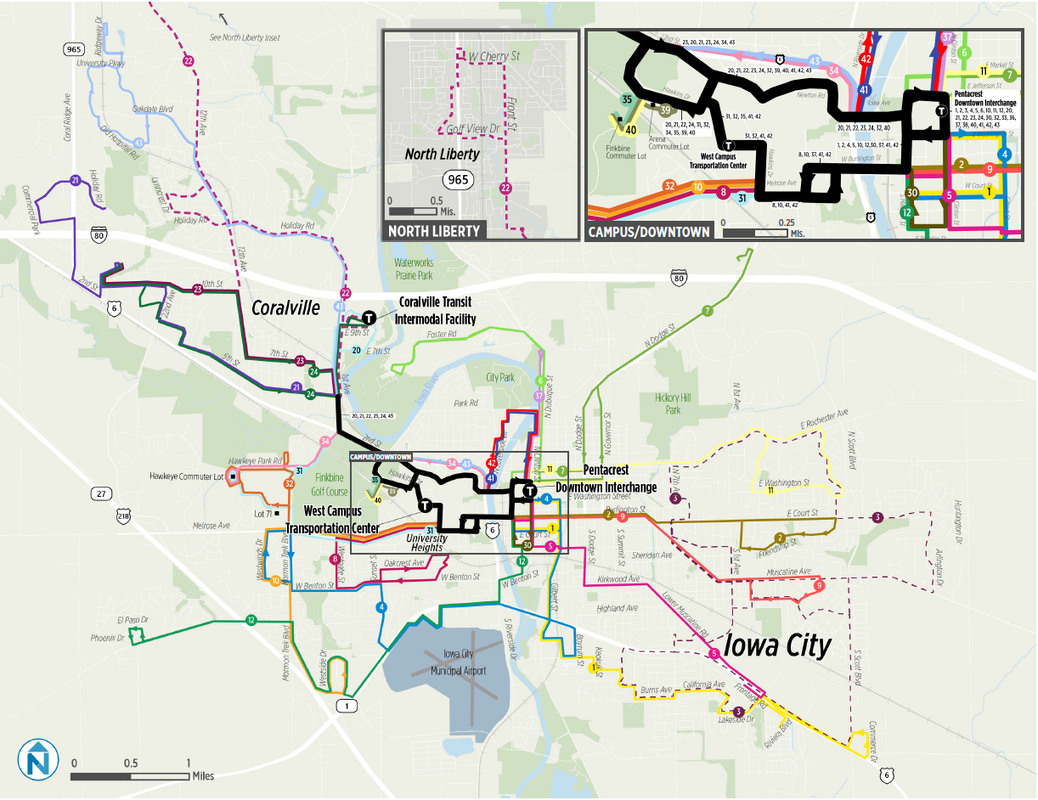 Scenario 1 Scenario 1, depicted above, aims to increase the frequency of popular routes, to simplify the route network, and to consolidate routes along major commercial and residential corridors. This consolidation centers mainly around downtown Iowa City, with only two high-frequency stops placed outside it at Towncrest and Oakcrest. This placement would shorten the reach of the transit system and may disadvantage Coralville and North Liberty residents. This scenario has the advantage of favoring the Iowa River Landing portion of Coralville, which holds many businesses and apartments, and promises to attract more riders to the system. Another advantage is the quicker run-times. A major complaint among residents is the inconsistency and infrequency of the bus system. If one bus is missed, a rider could be delayed 30 minutes to an hour, which greatly discourages residents who need transportation to their jobs, and to whom delay could mean unemployment. In this scenario, the Coralville route is broken up into six routes, which may improve the run-time of buses in Coralville, where the issue of delay is at its greatest. But the scenario does this at the cost of lessening the reach of the Coralville transit, and compelling riders to walk farther to catch the bus. Whether this trade-off is worth it will depend on the target ridership. The faster run-times will be better for workers, but the shorter reach will be worse for the elderly. If the city can offset this disadvantage with its on-call service, the trade-off may very well pay off. 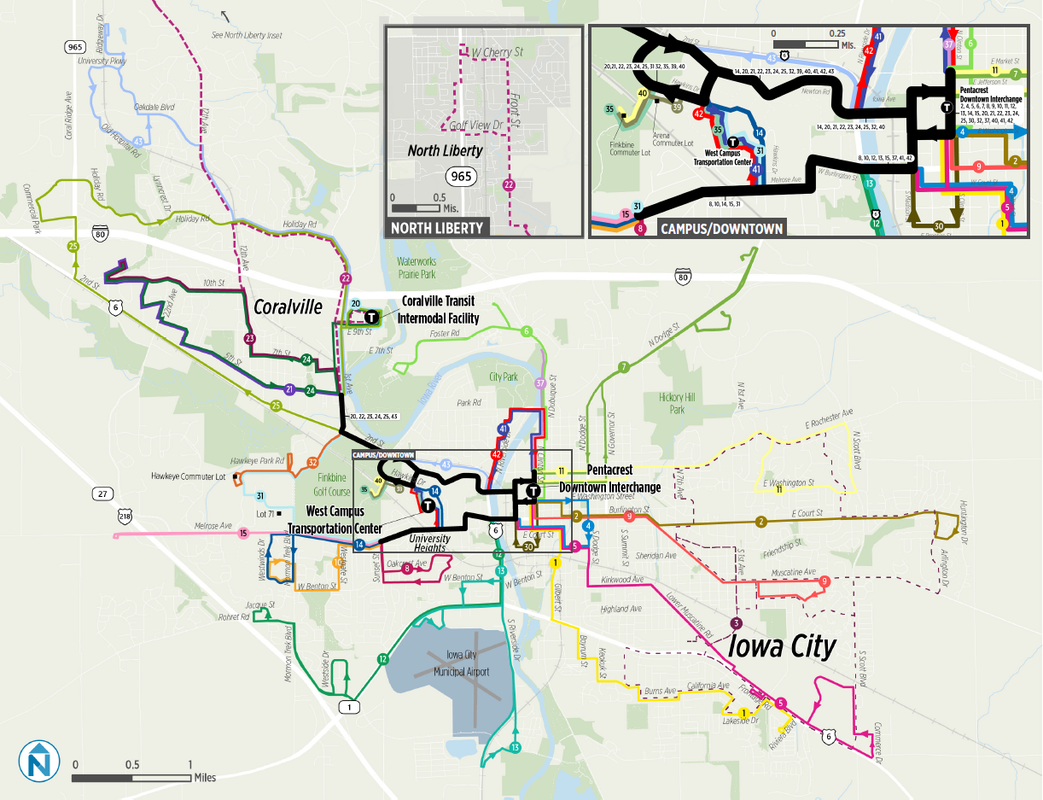 Scenario 2 Scenario 2, depicted above, is a more moderate version of the first scenario, and so shares many of its advantages and disadvantages. However, Scenario 2 does not include the projected 15-minute run-times that Scenario 1 boasts, except for in a few CAMBUS routes. Shortening the CAMBUS run-times would be advantageous since CAMBUS is fare-free and attracts a lot of riders. This scenario lacks the quicker run-time to the Iowa River Landing however it connects the route downtown, which may help workers in the Iowa River Landing area, particularly hotel employees. 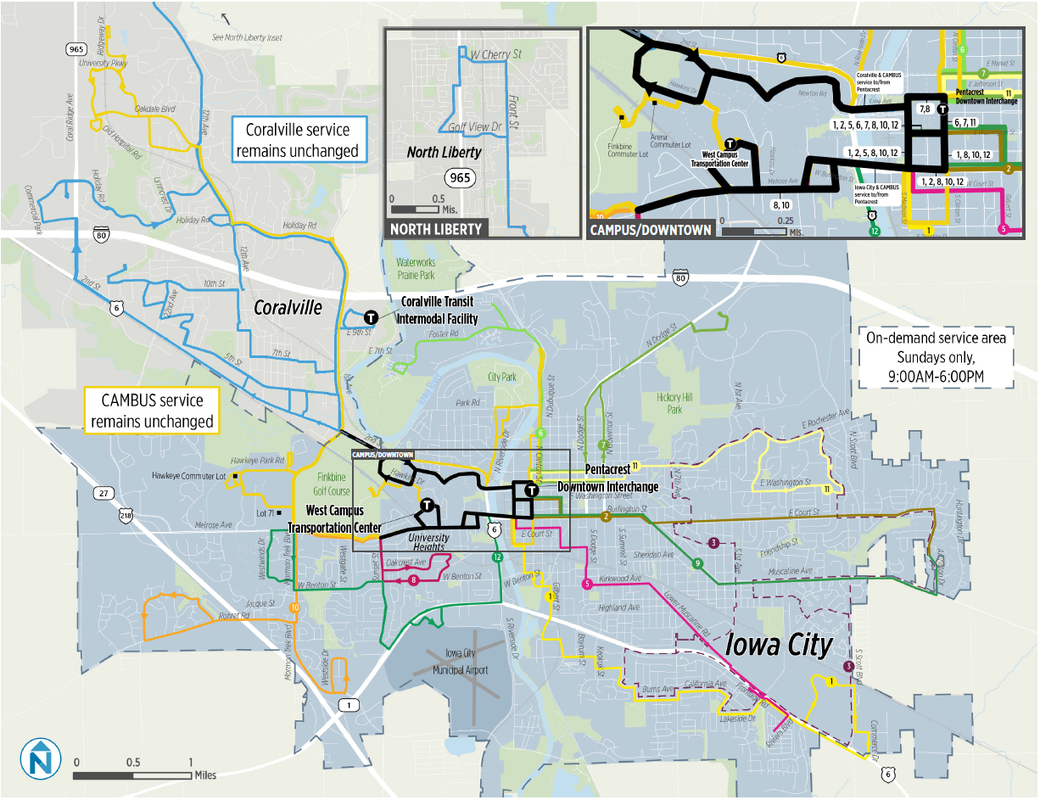 Scenario 3 Scenario 3, depicted above, expands service in the evening and on weekends. Based on CTC’s research on the transit needs of low-income workers, service in the evening and on weekends is acutely needed, and this scenario would be the most attractive to people who already ride the bus. This scenario also has the advantage of being able to gather data on the rates of ridership at times that the bus does not currently service, which would help the city ascertain the demand for evening and weekend services.
For commercial areas, weekends are especially important to service, since workers in the service industry work seven days a week (and often late nights). For this reason, evening and weekend access to the Coralville mall is especially important, as well as service to the hospital where shifts also extend late at night. This scenario also provides easier access to industrial parks in the southeast of town by consolidating the Broadway and Mall routes, benefiting low-income workers, which is one of the major targets for a public transportation system. While leaving most of the system unchanged may prevent reducing coverage in some areas, this scenario leaves the problem of speed, reliability, and frequency unsolved. And as the general trend of transit ridership in Johnson County has been decreasing, this may not be a satisfactory solution to a city that wants to turn around these losses. By: Jacob Atherton  The City of Iowa City has set an ambitious goal to lower our total greenhouse gas emissions by 80% by 2050, compared to emissions data measured in 2005. We as Iowa City residents now have 30 years to contribute to the ongoing progress to reduce emissions and lead as an example for other cities around the United States who see the need to do the same. Iowa City has the potential to demonstrate how a community can collectively adapt to the effects of climate change while empowering all residents to get actively involved, be heard, and benefit from and contribute towards efforts for a better future.
Emissions associated with transportation are Iowa City’s second-highest pollution source, following energy consumption from buildings. According to the Iowa City Climate Action and Adaptation Plan, roughly 2/3 of working people in Iowa City commute via their own personal car, and the majority of those who do so travel alone. There is quite a lot of potential to reduce our emissions by changing our transportation and mobility habits. Cars release their most toxic pollution within their first few minutes of operation, prior to reaching their optimum operating temperature. Because of this, when using a car to make a short distance, a single destination trip of two miles or less, higher levels of pollutants will be released per mile traveled compared to a car that is making a longer trip. Those quick runs to the store to grab a few items or a short commute to work really do add up over time, even if they don’t consume a lot of gasoline at the time. Vehicle travel is expected to continue to grow over time as Iowa City expands. More people, more cars, more short trips, and more time spent idling at stoplights. As informed citizens, we have a responsibility to shift our short errand trips and commutes from personal vehicle travel to public transit, cycling, and walking when possible. Iowa City, the University of Iowa, and Coralville will be presenting transit service improvements for each of their systems on January 28th, 29th, and 30th. In order for improvements such as fare reduction, fare elimination, the addition of bus stops, route changes, or service hours to be effective tools to reduce emissions while improving mobility for those who need it most, public feedback is crucial. Proposed improvements with clear public support are much, much more likely to be funded and implemented later this year. Participants of these public transit meetings will have the opportunity to complete a survey regarding these improvements and have their voices heard by working together with their community to reinforce ideas that can actually make an impact. |
 RSS Feed
